XYGraph Charting
download Nebula Visualization components from nebula release update site.

Create a new E4 Application

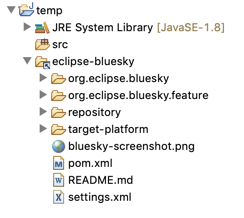
After the application is created, open plugin dependencies then add the following two plugins
- org.eclipse.nebula.visualization.xygraph
- org.eclipse.draw2d
As you see below

Now, add a part to your E4 Application and put the code you see below
public class SamplePart {

	@PostConstruct
	public void createComposite(Composite parent) {

		final Canvas canvas = new Canvas(parent, SWT.NONE);
		final LightweightSystem lws = new LightweightSystem(canvas);

		XYGraph xyGraph = new XYGraph();

		ToolbarArmedXYGraph toolbarArmedXYGraph = new ToolbarArmedXYGraph(xyGraph);

		xyGraph.setTitle("Toolbat Armed XYGraph Example");

		lws.setContents(toolbarArmedXYGraph);

		xyGraph.primaryXAxis.setShowMajorGrid(true);
		xyGraph.primaryYAxis.setShowMajorGrid(true);

		CircularBufferDataProvider traceDataProvider = new CircularBufferDataProvider(false);
		traceDataProvider.setBufferSize(100);
		traceDataProvider.setCurrentXDataArray(new double[] { 10, 23, 34, 45, 56, 78, 88, 99 });
		traceDataProvider.setCurrentYDataArray(new double[] { 11, 44, 55, 45, 88, 98, 52, 23 });

		// create the trace
		Trace trace = new Trace("Trace1-XY Plot", xyGraph.primaryXAxis, xyGraph.primaryYAxis, traceDataProvider);

		// set trace property
		trace.setPointStyle(PointStyle.XCROSS);

		// add the trace to xyGraph
		xyGraph.addTrace(trace);

	}

}
Finally, you have lo link the “SamplePart” part class to your E4 application and launch the application

references

0 Comments